Dashboard
Learn how to use the Blazelock dashboard overview to monitor scans, trends, and scan details.
The Dashboard page appears as Overview in the navigation and is the main monitoring page for an organization. It combines scan activity, statistics, and the latest file scans from all integrations in one place so you can understand what has happened recently and get a clear overview.
Dashboard layout
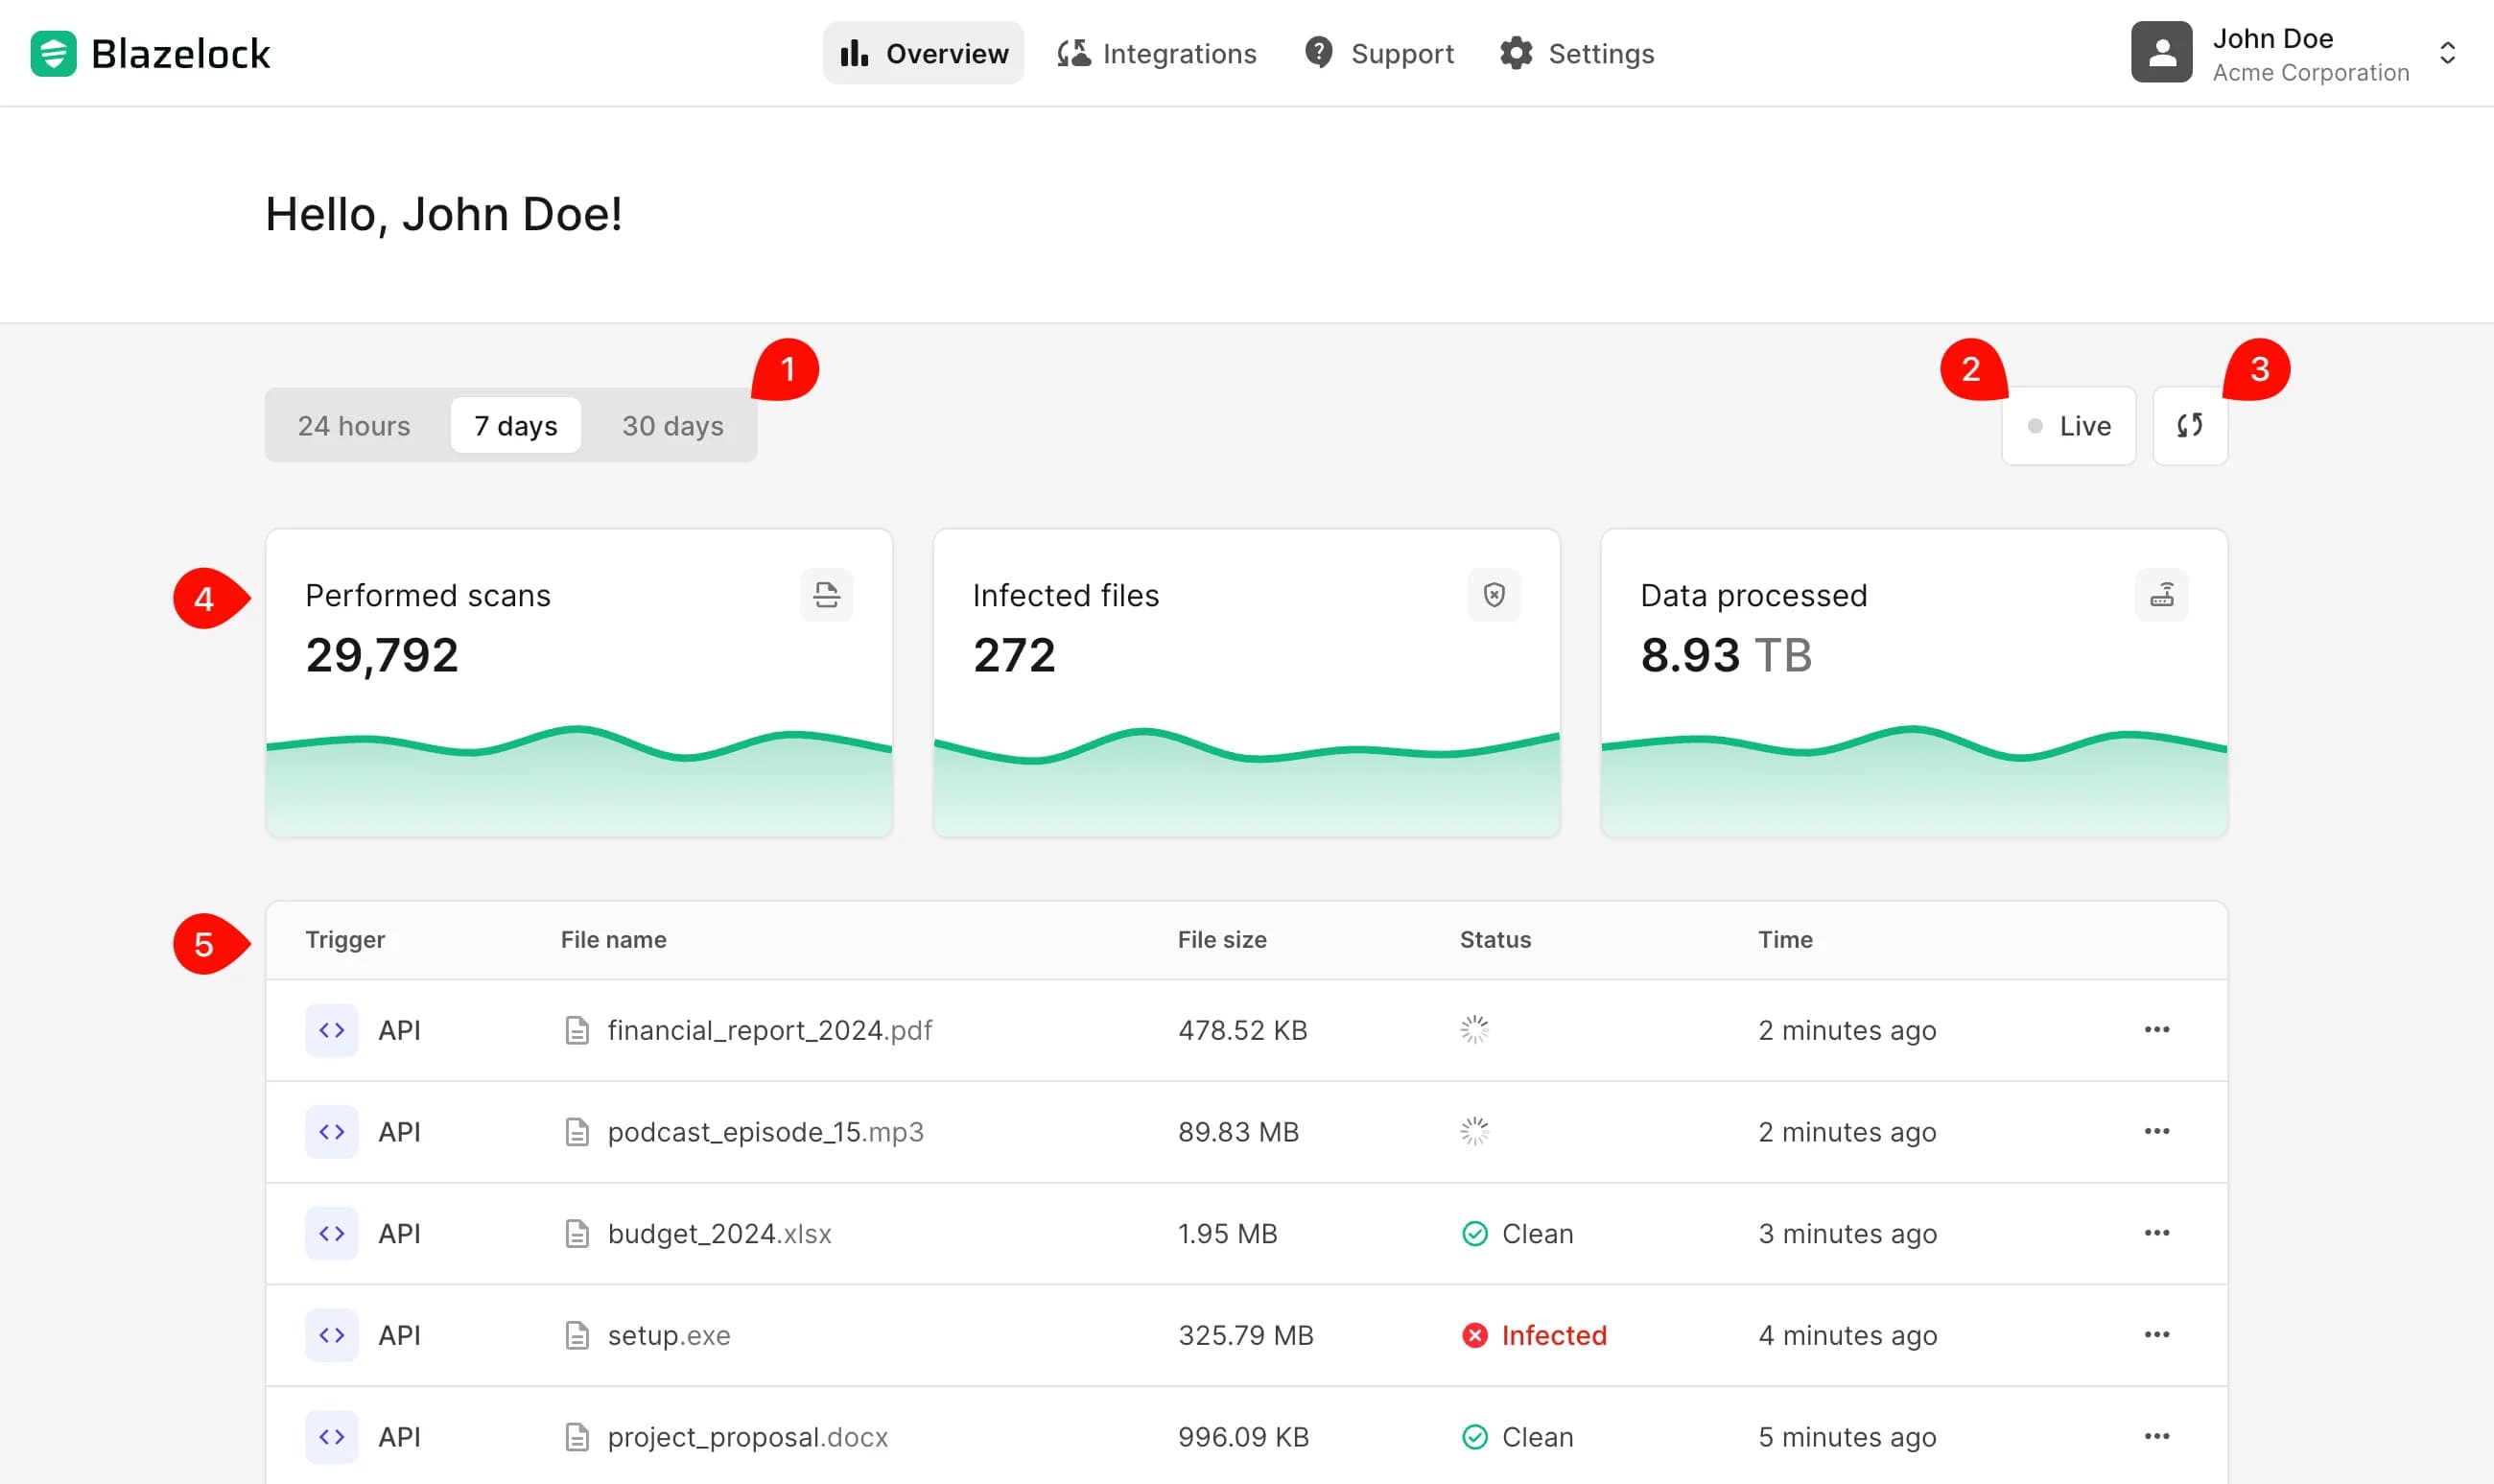
- Period selector changes the reporting window between the last 24 hours, 7 days, and 30 days.
- Live mode refreshes the dashboard automatically in the background so new scans and updated statuses appear.
- Manual refresh fetches the latest data.
- Trend charts visualize how scan activity developed during that period.
- Recent scans table lists scans from all integrations in the current organization that were submitted in the selected period.
Understand the statistics
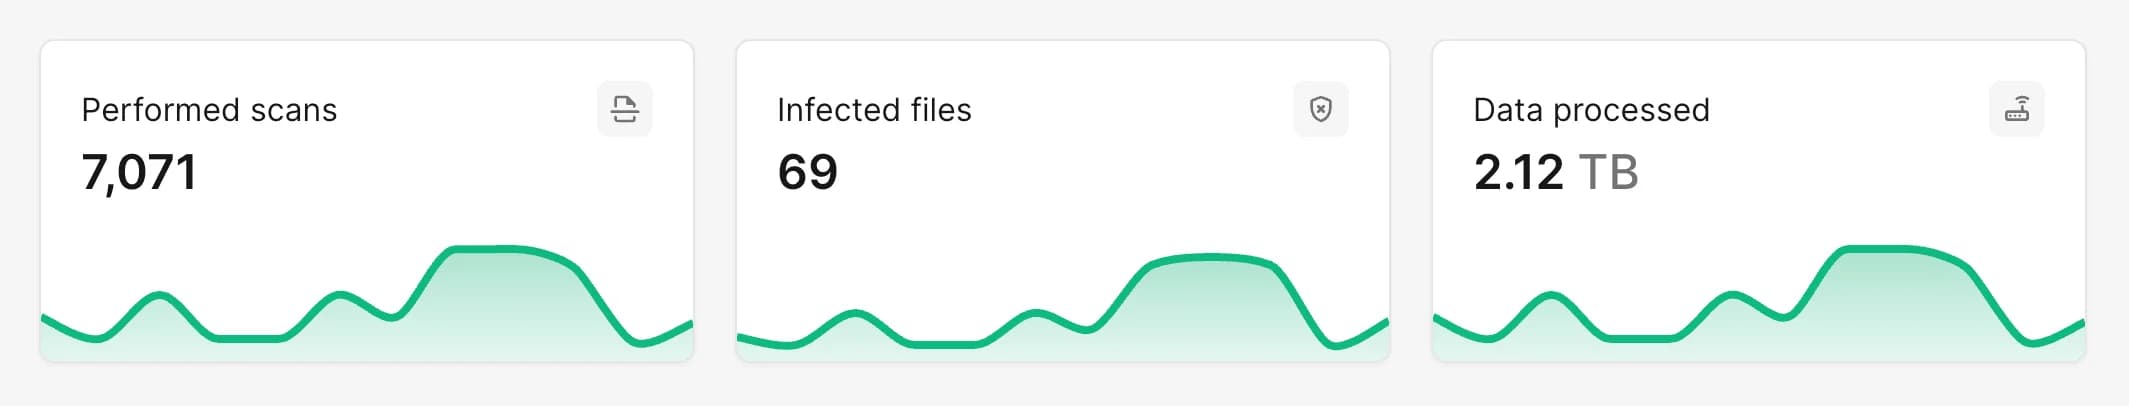
The statistics section summarizes the selected period with three top-level metrics:
- Performed scans shows how many file scans were submitted in the selected period.
- Infected files shows how many completed scans were classified as infected.
- Data processed shows the total amount of scanned file data in the selected period.
Each card also includes a trend chart. The chart helps you see how the metric developed across the selected time range.
Review recent scans
The table below the statistics section lists the latest scans from all integrations in the current organization for the selected period. It is the operational view you will use most often when checking what was scanned recently.
Scan statuses
| Status | Meaning |
|---|---|
Processing | The file is still being scanned. |
Clean | The scan completed and no threats were detected. |
Infected | The scan completed and malicious content was detected. |
Warning | The scan completed and suspicious content was detected. |
Failure | The scan could not be completed. |
Open scan details
To inspect a single scan more closely, open the row menu in the table and select Open details.

The detail dialog gives you the most complete view of one scan. Depending on the result, it can include:
- File information such as the file name, file size, and detected file type
- Scan details such as the scan ID, trigger, and current status
- Threats detected when the scan result is infected
- Warnings detected when the scan result is warning
- Timing information such as when the scan was submitted, when it completed, and how long it took
- File hashes for completed scans
- Error details with an error code if the scan failed
If the selected scan is still processing when you open the dialog, the status updates automatically until the scan finishes.